Discover Your Perfect Suburb With Your Patch
First National Real Estate's Innovative Tool For Australian Home Buyers And Renters
What You Need To Know About 'Your Patch'
First National Real Estate is excited to announce the launch of ‘Your Patch’, an interactive dashboard designed to help Australian home buyers and renters find the perfect suburb based on their unique preferences and financial capabilities.
The ‘Your Patch’ dashboard aims to bring Australians together by offering a comprehensive platform to explore and understand the diverse housing markets and communities that make up our nation. Whether you're a homebuyer or renter, Your Patch is the perfect tool to help you find the right suburb to call home.
Your Patch offers valuable demographic statistics, making it easier than ever to compare and understand Australian suburbs to identify the best capital growth opportunities or suitable rental homes.
It provides users with comprehensive information on housing and community profiles using the latest Census data.
- Explore the housing and community profile of any Australian suburb
- Access vital demographic statistics to understand how any Australian suburb compares to ‘Your Australia'
- Determine the most appropriate rental home based on your income and each suburb’s median weekly rental costs
- Identify the most appropriate home to buy based on capital growth opportunities, your income and ability to repay a mortgage
- Determine the most appropriate investment property to buy based on desirability for tenants and types of housing
- Stay informed on the social and demographic characteristics and housing stock of specific localities
- Monitor how much a suburb's community has changed over a 5-year period.
- Gain insights into homeownership and rental trends in each suburb
- Using the Your Patch dashboard, users can access a wealth of information on any suburb in Australia, such as the proportion of the population born overseas, household composition, average number of people per dwelling, median monthly mortgage repayments, median weekly rent, and more
How To Inform Your Local Area About The Power Of Your Patch
To coincide with the launch of Your Patch, we have compiled a blog that you can use to spread the word about this new product from First National Real Estate, and how it can help your current and potential buyers, investors and renters determine the right suburb for them, as they take the next step in their personal real estate journey. By clicking the button below, you will be able to download the blog itself, the featured images, and a range of tiles that you can use on your social media accounts.
Please Add The Your Patch Blog To Your Website Now
Step 1: Click on the below button to download the word document, featured blog images, and social media posts.
Step 2: Upload the word document as a blog on your website. To learn how to upload a blog, click here or watch the webinar. If you're not with Zenu, contact your website provider for details.
Step 3: Once you upload your blog, advertise it on social media. We've provided posts you can publish. Make sure you add a link to your post for people to click through.


Learn More About Your Patch With Bernard Salt
How To Add Your Patch To Your Website
In order to give your buyers and renters the best possible opportunity to use Your Patch in their property search, its pivotal that you add the dashboard to your website and begin utilising this innovative tool in your marketing today! Below are some general guidelines for how you can have this added to your website, based upon the website provider you use.
Zenu
- If you are currently using a V1 Zenu website, you should add the blog to your website to get the message across about Your Patch and its benefits for your buyers and renters, as well as a menu item that links to the blog.
- You can access the blog and blog featured images at this link.
- If you wish to have the dashboard added to your website, this will be much easier done if you upgrade to a V2 website. If you have any questions about upgrading, or the possibility of adding the dashboard to your V1 website, contact Zenu Support.
If you are currently using a V2 Zenu website, please follow the below steps to add Your Patch to your website.
- 1. Create a new page for Your Patch on your website and add the Your Patch logo and introduction copy provided at the link below.
- 2. Add a new section on the page and select the iFrame widget, and place this URL into the widget and save your work.

- 3. Add a new menu item to your website which links to the Your Patch page.
- 4. Add a widget on your home page that links to the Your Patch page that you have created.
- 5. If you have previously added the Your Patch blog to your website, alter the text to add in the link to the Your Patch page on your website
*If you require any assistance with the above steps, contact Zenu Support at support@zenu.com.au, or on 1300 136 063.
Other Website Providers
If you are with another website provider, contact their Support Team and provide them with the Your Patch dashboard URL, which you can access here, so that they can apply this to a page on your website. You can also access the above resources, including the Your Patch logo, images, blog, and copy, which you can use to further promote Your Patch on your website.
How To Add Your Patch To Your Social Media Pages
Amplify your social media presence as the local housing market expert by leveraging Your Patch statistics. Use our new Design Hub templates to showcase these compelling stats and captivate your audience. Start building your online influence today!


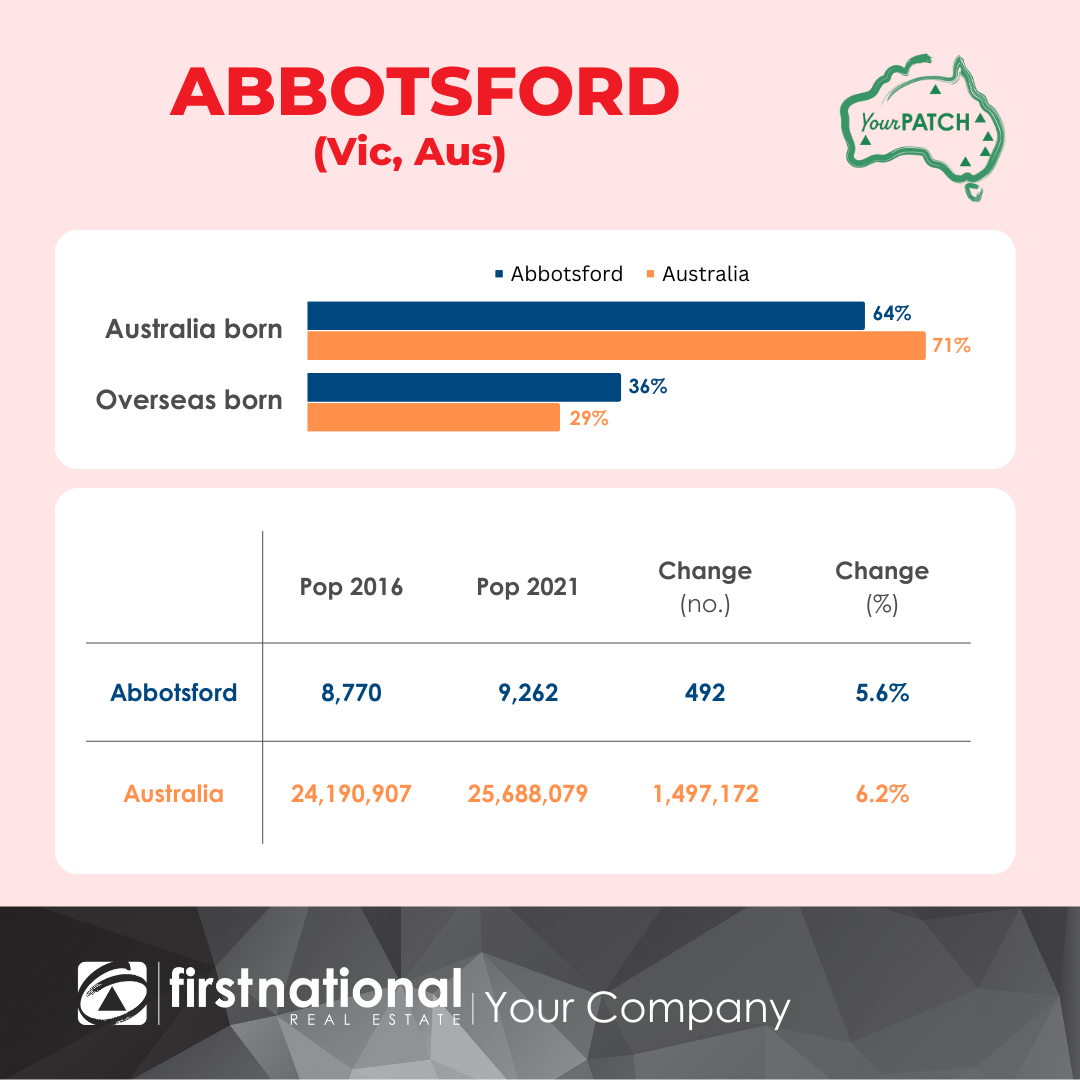
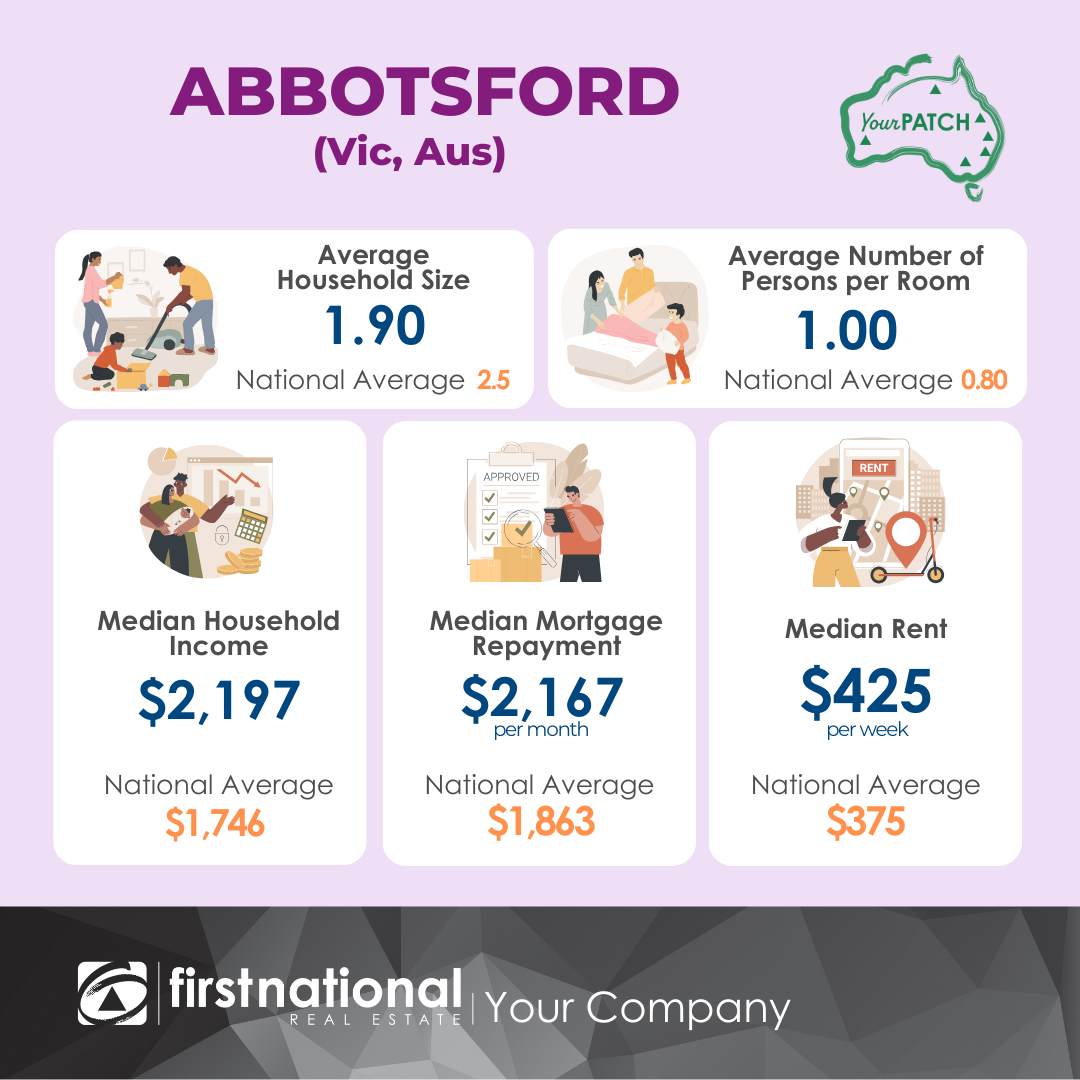
Questions and Answers
Q1. What is Your Patch?
Your Patch is a dashboard designed for you to add to your website that helps your customers find the perfect suburb based on their unique preferences and financial capabilities.
It turns complicated Census data into useful, easily understood information that shows people where they can afford to live, the types of homes in your area and what average rent or mortgage repayments cost.
Q2. Why should I put Your Patch on my website?
- To attract more customers to your website with better information than your competitors
- To keep customers on your website for longer
- To build respect for your agency in your community
- To create more opportunities to do business
Artificial Intelligence (AI) could turn everything we know about Search Engine Optimisation on its head. Websites without plenty of useful information could disappear from search altogether.
Your Patch gives your website a unique point of difference and is very useful for your customers.
Q3. What will tenants get from Your Patch when on your website?
We’re in the middle of a rental property affordability crisis, which is why tenants will want the information you have.
Your Patch shows tenants the median rent per week and how that compares to the national average.
It also breaks down the types of dwellings in your region by suburb, showing where there are the most flats, semi-detached and freestanding homes.
Q4. What will homebuyers get from Your Patch when on your website?
For homebuyers, Your Patch identifies median household incomes as well as mortgage repayments per month, and how they differ from the national average.
It shows where buyers will find the type of home they want and how many people have moved to that suburb in the past 5 years and past 12 months – a great indicator of popularity and likely future capital growth.
It shows family compositions, renters versus homeowners, how many homes are unoccupied, Australian-born versus overseas-born and the gender balance.
Q5. What will investors/landlords get from Your Patch when on your website?
For investors – your future potential landlords/rental providers - Your Patch shows them where people want to rent, how many people have moved into a suburb over the past 5 years (potential demand for their rental).
They can see what sort of rent they can anticipate, compare likely yields by comparing data to other nearby suburbs and the national average, and see how much their monthly mortgage repayments are likely to be.
Critically for investors, the rate at which the population is changing and the average number of people forming households provides clues about how much demand might influence future capital growth.
Q6. How can my sales team use the information in Your Patch?
Your salespeople can position themselves as the best-informed real estate agents in your community by communicating why:
- A buyer would want to choose a home in your locality
- An investor would want to buy a rental property in your locality
They should leverage the data of interest to buyers and investors explained in questions four and five.
Q7. How can my investor relations managers/property managers use the information in Your Patch?
Your property managers can position themselves as the best-informed and most helpful in your community by communicating why:
- Tenants would want to choose a home in your locality
- Tenants can afford a home in your locality
- Investors would want to buy a rental property in your locality
- Investors would choose your property management services over competitors
They should leverage the data of interest to tenants and investors explained in questions three and five.
Q8. How can I use Your Patch in my social media?
People find information about their area and how it compares to ‘middle Australia’ fascinating. You can drip feed social media posts about:
- Tenure type i.e., percentage of property rented, owned with mortgage, owned outright
- Family composition i.e., non-family household, couple families with no children, couple families with children and one-parent families
- Dwelling structures:
- Flats or apartments in a 1 or 2 storey block
- Flats or apartments in a 3-storey block
- Flats or apartments in a 4 to 8 storey block
- Flats or apartments in a 9 or more storey block
- Separate houses
- One storey semi-detached, row or terrace house, townhouses etc.
- Two or more stories semi-detached, row or terrace house, townhouses etc.
- Average household size (number of residents) vs national average
- Average number of persons per bedroom vs national average
- Median household income vs national average
- Median monthly mortgage repayment vs national average
- Median weekly rental payment vs national average
- Usual address 5 years ago
- Usual address 1 year ago
- Population change from 2016 to 2021
- Occupied versus unoccupied dwellings
- Country of birth of persons
- Annual change in population
- Estimates of resident population by age and gender
- See how a suburb of interest compares to any other suburb in Australia
Q9. How can I use Your Patch in newsletters or blog posts?
Your Patch data is presented in a user-friendly, visual format, making it easy for anyone to understand and interpret.
You could, for example, write a Blog post that would interest customers interested in Rouse Hill, describing it as an outer suburb of Sydney where your readers could:
- Learn that the area saw a 3% increase in residents over five years
- That 61% of dwellings having a mortgage
- That 73% of households are comprised of a couple family with children
This valuable information can help users make informed decisions on where to buy or rent based on their specific needs and preferences.
Q10. Why can't I find my suburb in Your Patch?
As Your Patch utilises Census data for its data collection, areas are categorised based on SA2 regions or Main Statistical Area Structure, as opposed to suburbs or local government areas. In order to locate the SA2 that your suburb or LGA falls within, you can use this tool on the ABS website.
Q11. Why does the data in Your Patch not reflect the current state of our local market?
Given that Your Patch is derived from Census data, the most recently available information is that acquired during the 2021 Census.
*Data within the Your Patch dashboard is provided by the Australian Bureau of Statistics (Census 2021).


